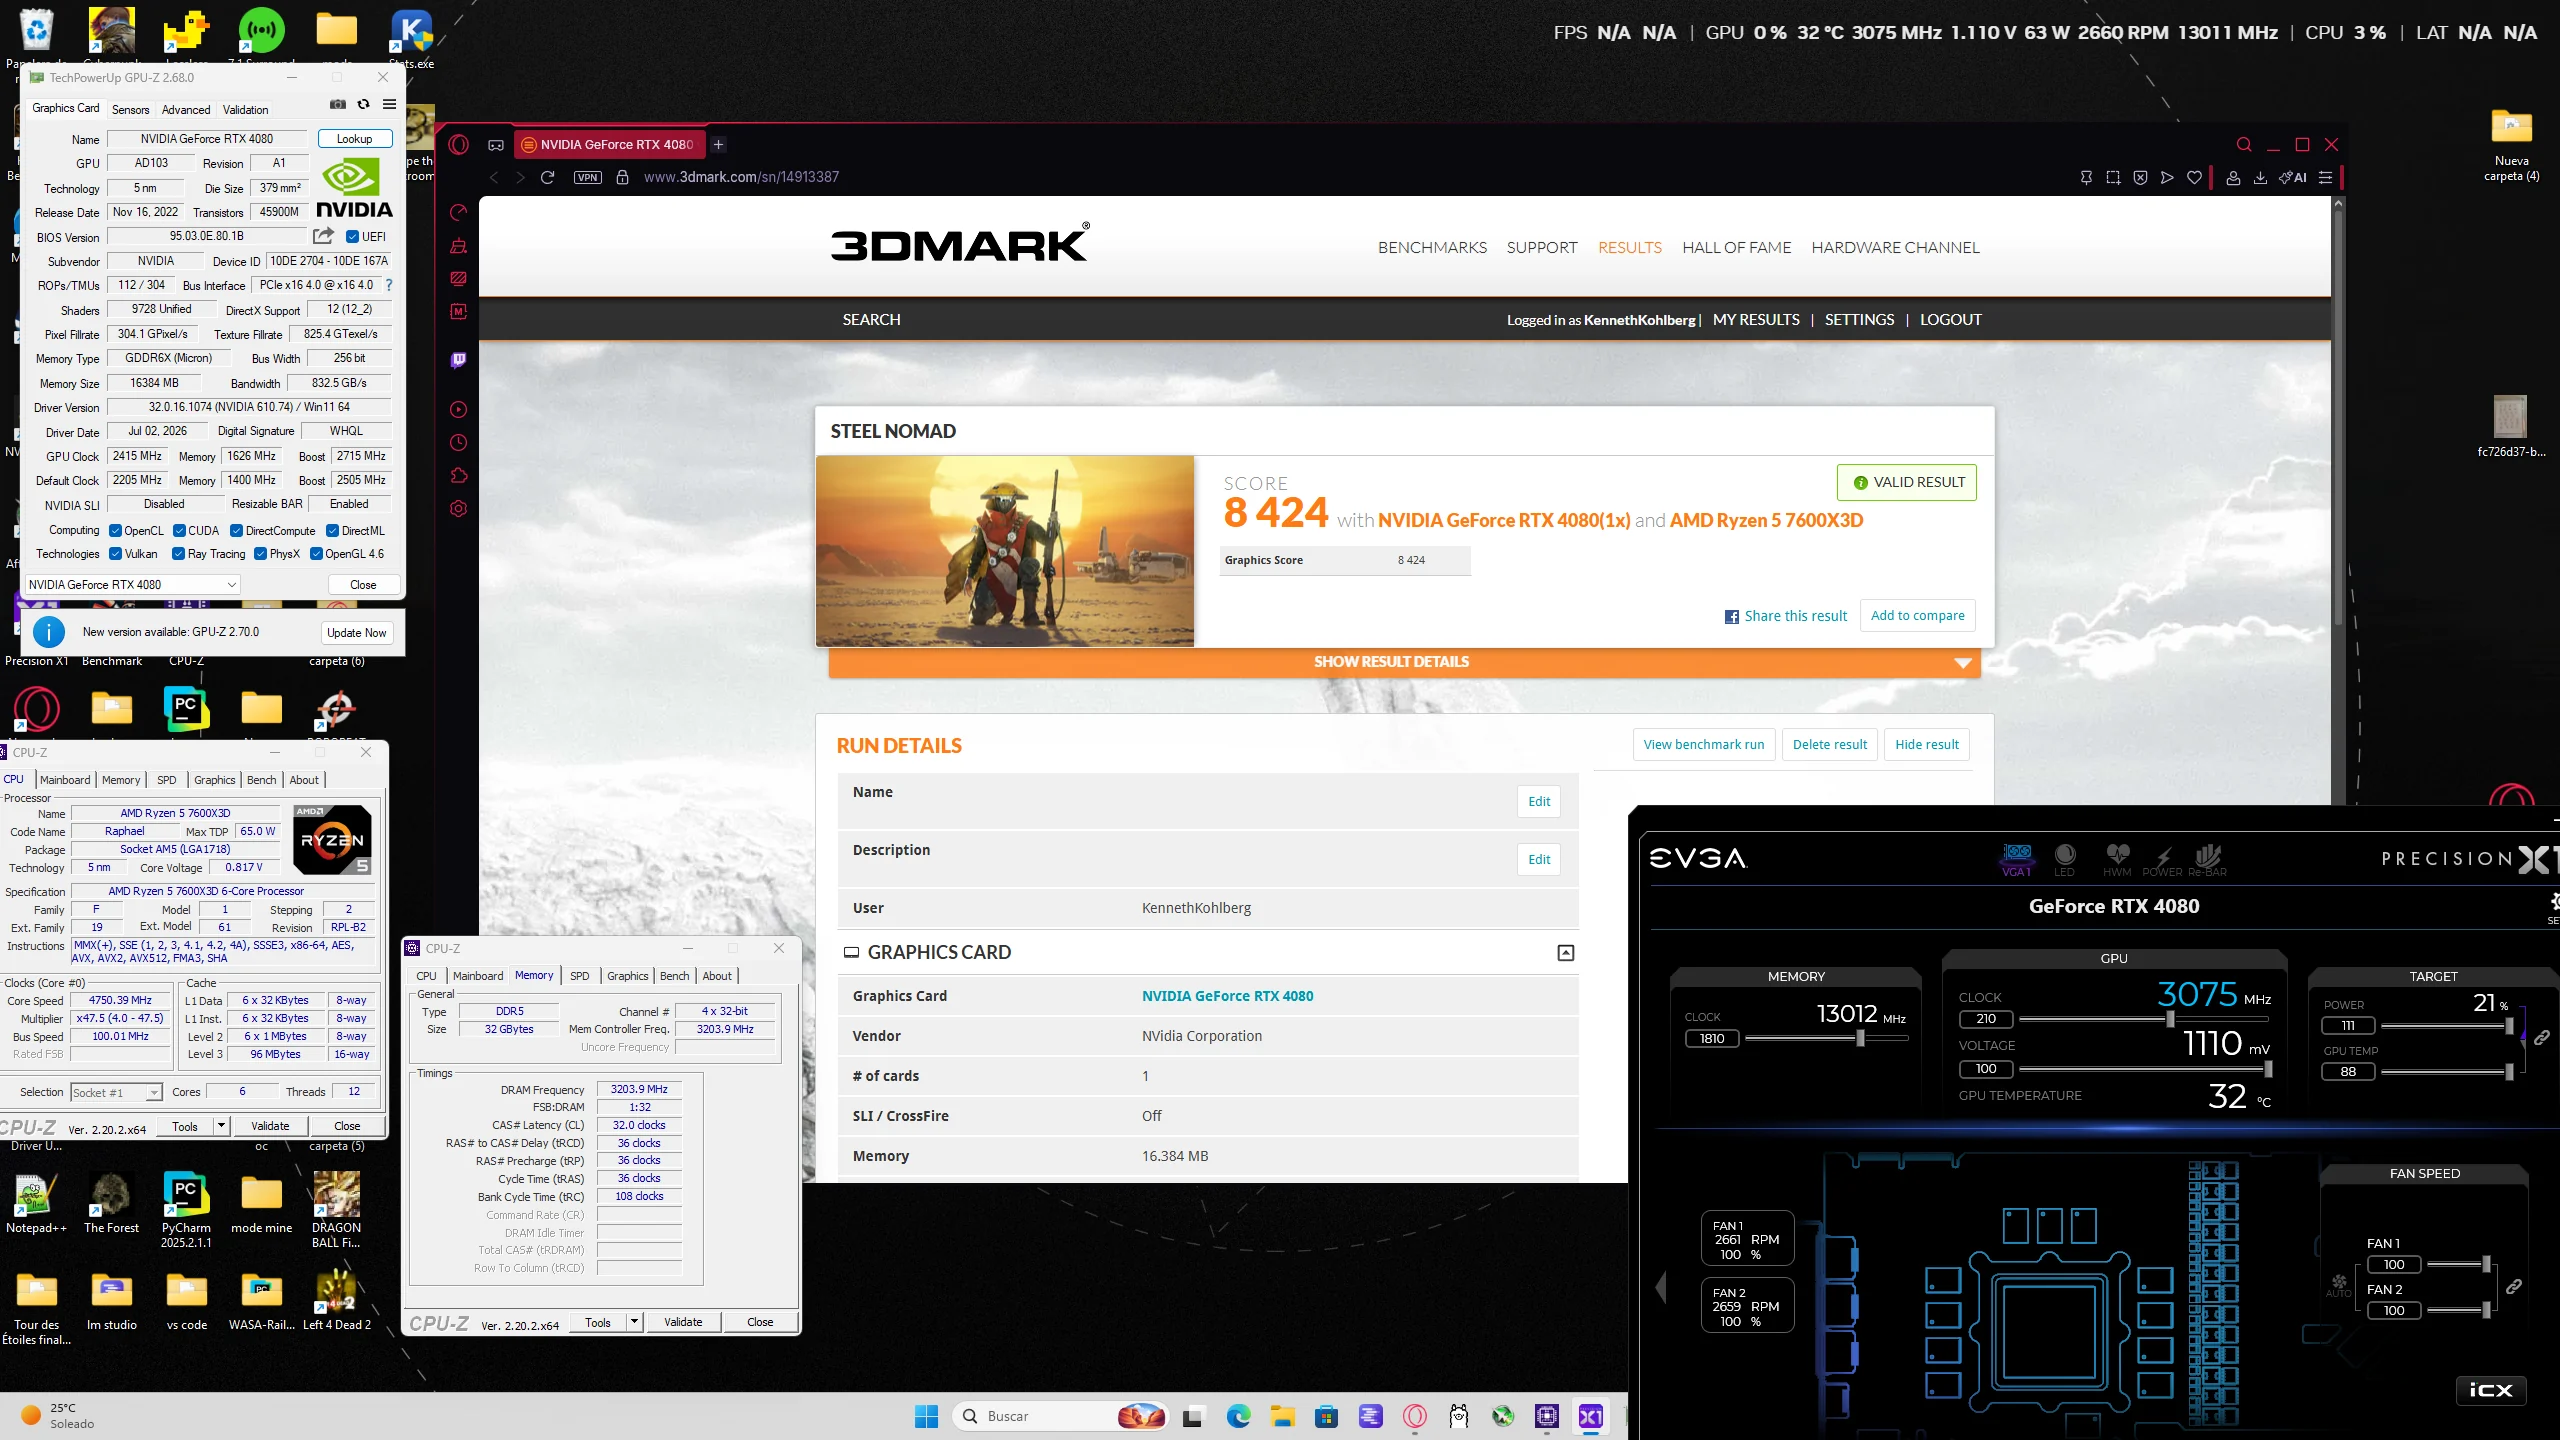
8424
marks · 3DMark Steel Nomad DX12
RTX 4080 Overclock: Kenneth Kohlberg's 8424 Steel Nomad Record
Tarija, Bolivia
3DMark Steel Nomad DX12 — 8424 marks — RTX 4080 Founders Edition, air cooled, stock vBIOS.
First out of 136,085 results, and ahead of every RTX 4080 SUPER result.
The numbers
Second place on the RTX 4080 is tymcguire22, 8273 marks at 2940/1641. The RTX 4080 SUPER has 212,451 results and an average of 6608, on 10240 CUDA cores against the 4080's 9728 and memory binned at 23 Gbps against 22.4.
The result
8424 marks is the fastest RTX 4080 result in UL's 3DMark database, out of 136,085 RTX 4080 results. The average for the card is 6576, placing this run 28% above the mean.
Only six RTX 4080 results in the entire database have passed 8000 marks. Two of them belong to this card (8424 and 8221).
It also exceeds the SUPER
8424 marks is higher than the best RTX 4080 SUPER result ever recorded in the same database: 8326 marks, set by jamez74 in December 2024 and not beaten since — eighteen months, across 212,451 SUPER results.
That is the harder comparison, because the SUPER is the better card. It carries 10,240 CUDA cores against the 4080's 9,728, a 5.3% advantage, and its memory is binned at 23 Gbps against 22.4. It is also the variant enthusiasts bought for this purpose: 212,451 results against 136,085, some 76,000 more attempts at the same chip.
| RTX 4080 | RTX 4080 SUPER | |
|---|---|---|
| CUDA cores | 9,728 | 10,240 |
| Memory bin | 22.4 Gbps | 23 Gbps |
| Results in database | 136,085 | 212,451 |
| Average score | 6576 | 6608 |
| Highest recorded score | 8424 (Kohlberg) | 8326 (jamez74) |
| Date of that result | 13 July 2026 | 24 December 2024 |
Core clock is not the lever
The card reaches 3100 MHz on the core. The record was set at 3030.
A Founders Edition has a power budget that cannot be raised, so core clock and memory clock compete for the same watts. Every MHz of core taken is a MHz of memory given up.
The RTX 4080 results in the database show no relationship between peak core clock and score. Runs at 3255, 3150, 3135 and 3120 MHz scored 7549, 7521, 7577 and 7534. The 3030 MHz run scored 8424. The figure 3DMark reports is the peak clock the driver observed, not the clock held for the length of the run.
- Kenneth Kohlberg
- Everyone else
Finding the memory ceiling
GDDR6X uses PAM4 signalling, which carries two bits per symbol. That doubles transfer efficiency but leaves a weak signal-to-noise margin and makes the bus sensitive to PCB quality and temperature. NVIDIA compensates with Error Detection and Replay (EDR): a CRC on the memory bus that catches transmission errors and retries each transfer until it succeeds.
EDR inverts the usual method for finding a memory ceiling. Because errors are corrected rather than displayed, artifacts and crashes stop being useful indicators. The score itself becomes the instrument: it climbs, flattens as replays begin consuming bandwidth, then declines — with the card appearing perfectly stable throughout. The usable ceiling is the top of that curve, not the point of failure.
On this card the curve turns at 1626 MHz. Past it, performance regressed instead of improving, so the clock was brought back down. 1626 is not where the card stops working; it is where it stops getting faster.
Beyond the curve there is no gradual decline. One further step produces a black screen and a full system shutdown requiring the PSU to be cycled. A second, thermal failure mode terminates the run and returns to the benchmark menu — a driver timeout, not corruption; the record run was made in winter because lower ambient widens the stable window on a PAM4 bus. Both failure modes are loud. Neither produces the pattern that should make a result suspect: a completed run, a valid score, and visible artifacts.
Method
Three stages, in order. Tuning both clocks simultaneously reveals nothing about which one moved the score.
- Core alone, memory at stock, stepped to failure. Ceiling: 3100 MHz.
- Memory alone, core at stock, stepped while watching the score curve rather than the screen. Ceiling determined by performance, not by crash.
- Balance point. With both ceilings known, find the split of the power budget that maximises the score rather than either clock. Result: 3030 / 1626. Seventy MHz of core traded for memory clock, and the score rose.
Thermal setup: the fans run at 100% for the length of every 3DMark run. The phase-change pad on the die was cured before use: twenty-five cycles, each about two hours hot, then left to cool to 35 °C before the next one begins.
Configuration
| GPU | RTX 4080 Founders Edition, stock vBIOS, 3030 / 1626 MHz |
| GPU cooling | Stock FE cooler, phase-change pad on the die |
| CPU | Ryzen 5 7600X3D @ 4750 MHz, Curve Optimizer -55 all-core via PBO2 Tuner |
| CPU cooling | Deepcool AK620, Thermal Grizzly Kryonaut |
| Memory | G.Skill Flare X5 DDR5 32 GB, rated 6000 CL36, running 6400 CL32-36-36-36 |
| Motherboard | ASUS ROG Strix X670E-E Gaming WiFi |
| PSU | ASUS ROG Strix 1200 W |
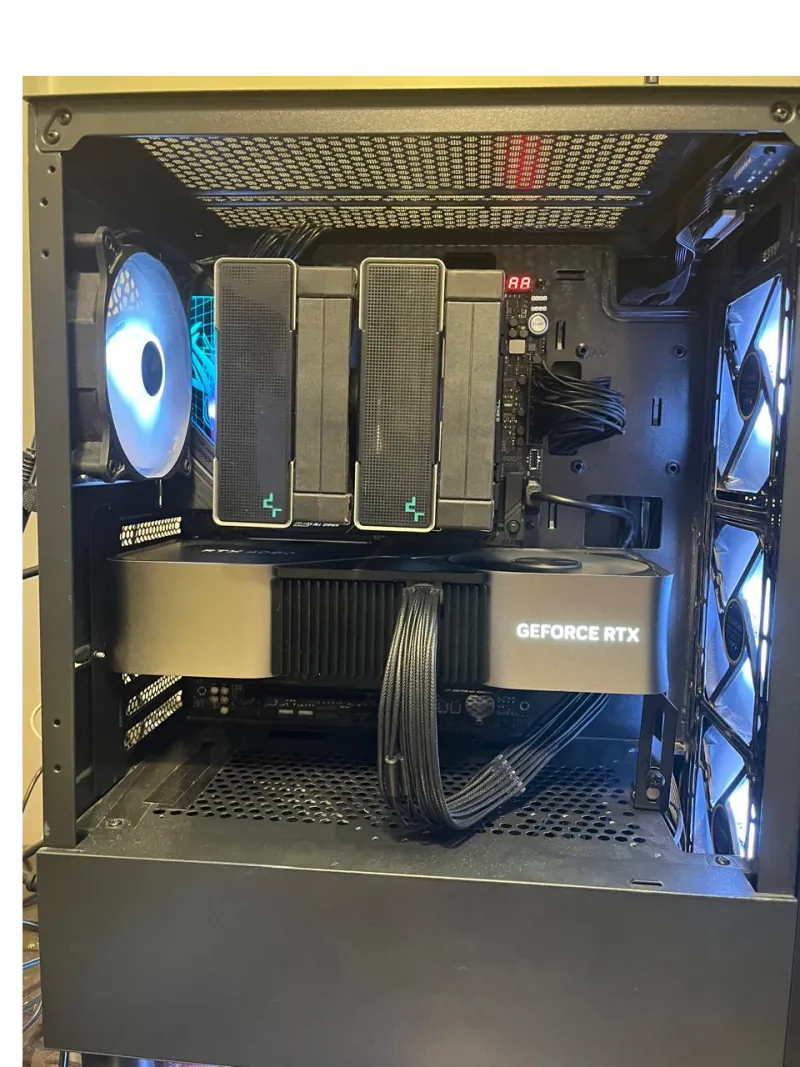
In Steel Nomad the overall score equals the graphics score, so the CPU contributes nothing to this number. Worth stating, because results of this kind are assumed to require a halo CPU. A six-core produced this one.
About
Kenneth Kohlberg is an overclocker based in Tarija, Bolivia, competing on HWBOT as KennethK. All results are on retail hardware, air cooled. Contact: kennethkohlberg77@gmail.com